Download Product Ebook
 View all our solutions
 Sky-Walker Architecture
 View all our integrations
 Book Protocol workshop
 Our Company
 Contact Us
 View All Our Case Studies
 English
 Français
 Nederlands
Enhance your daily security with dashboards and statistics.
What is the role of security dashboards?
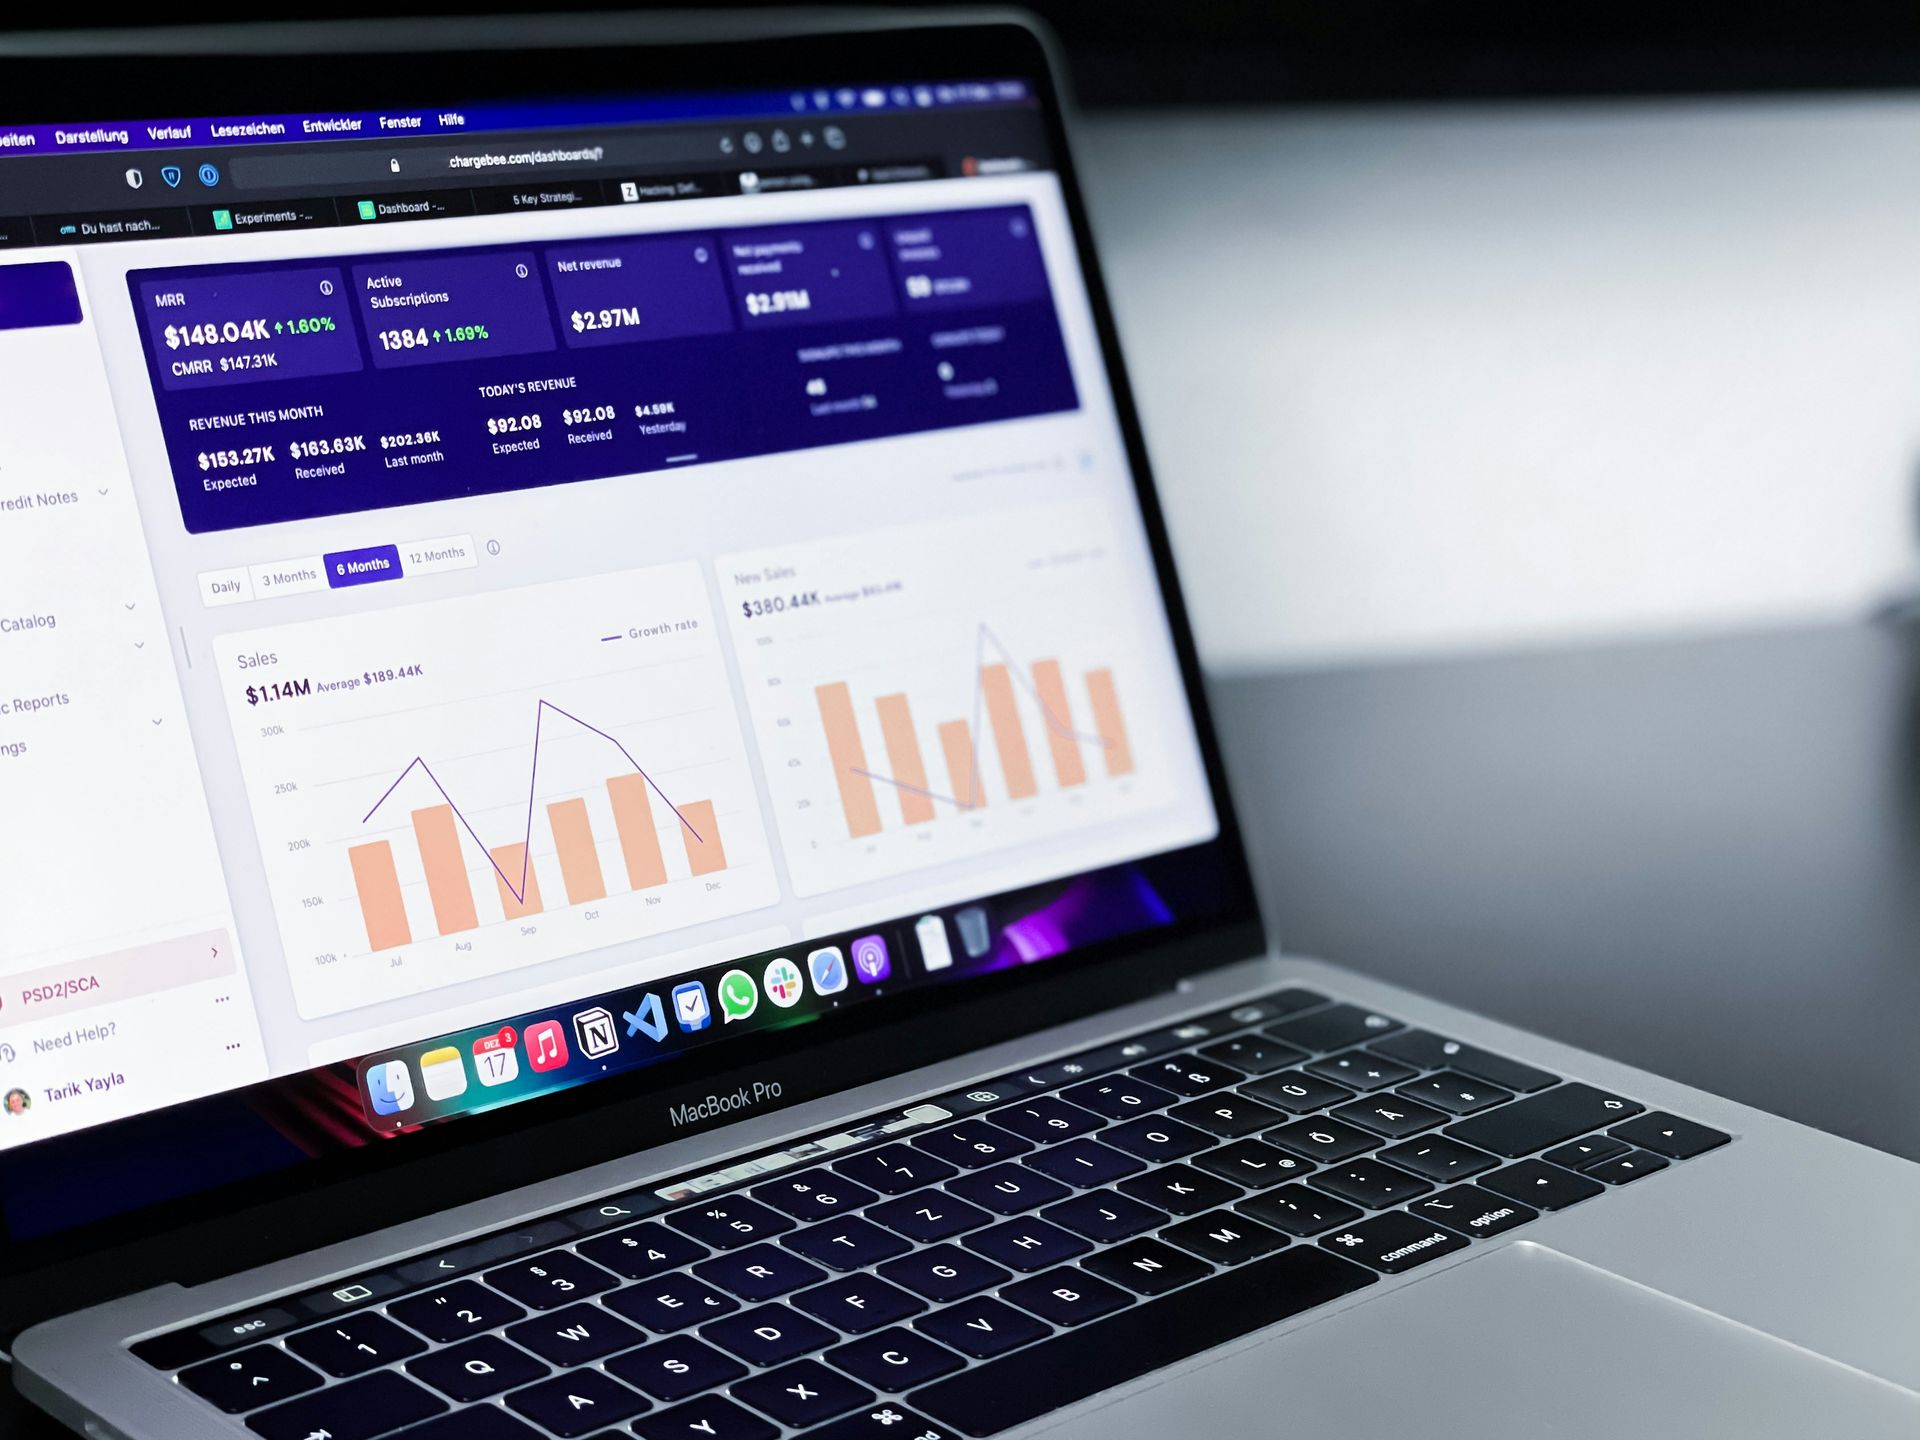
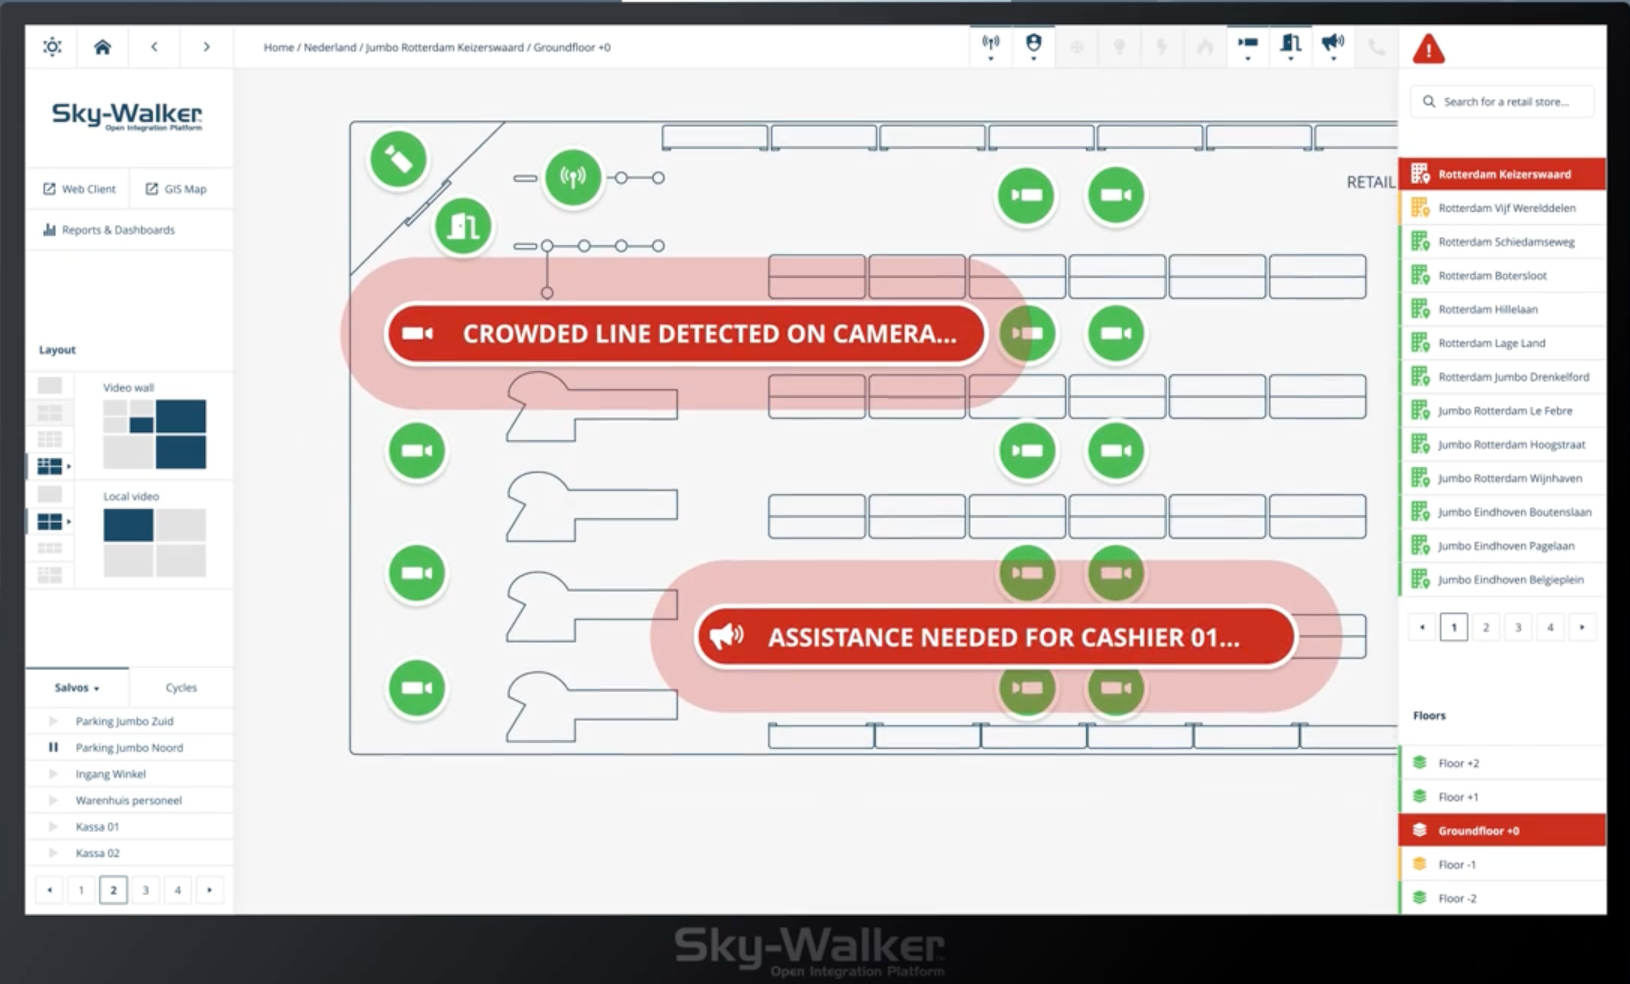
Managing safety and security systems and equipment through PSIM software is essential, but it's just the first step to optimize your daily security. Another step involves cataloging your building's data through personalized dashboards and analyzing the data with statistics.
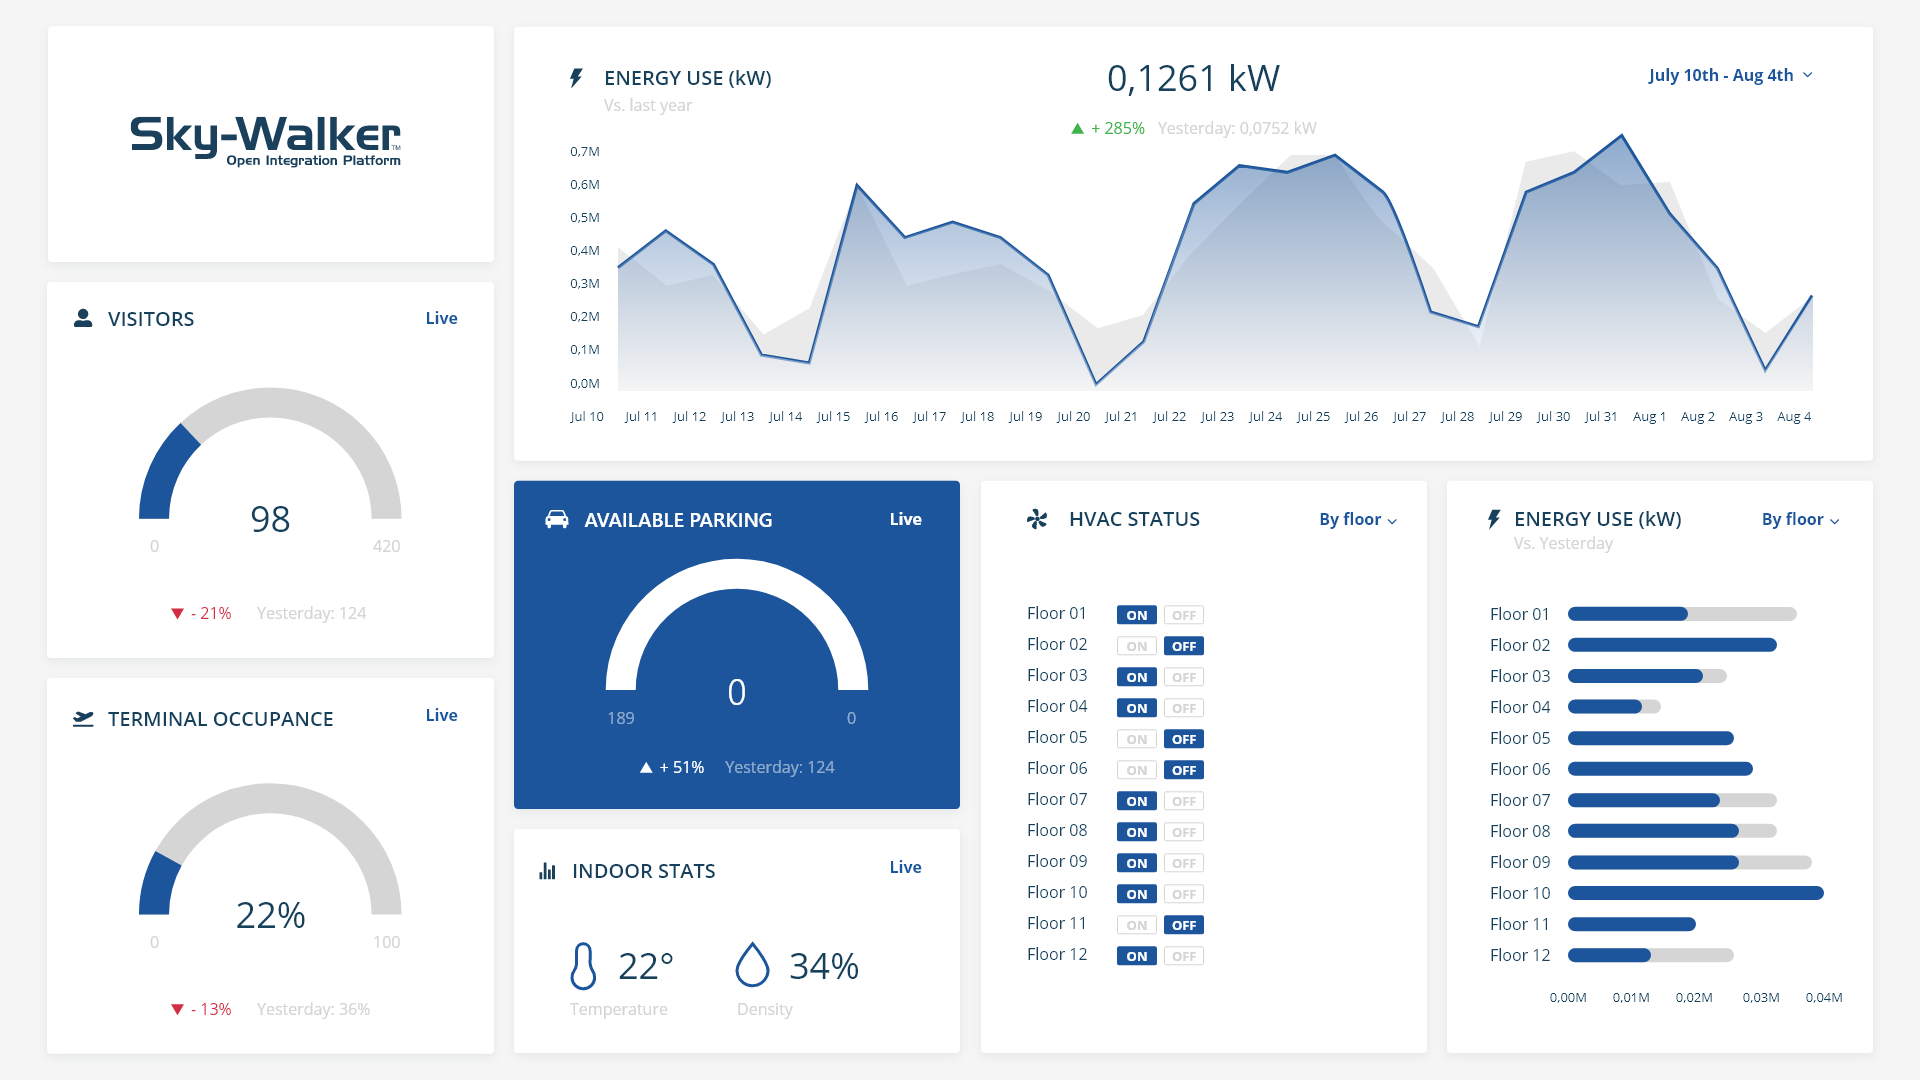
A security dashboard is a tool that allows any user to have an overview of the most important information regarding the security, safety, and comfort of various infrastructures. These include data such as the number of occupants, the number of malfunctioning systems, and the systems most impacted by incidents, giving you a precise overview of your building's security.
In addition to providing an overall view of infrastructure security, personalized dashboards will be synonymous with optimization. For example, you'll be able to schedule maintenance on the most faulty systems or even plan equipment changes.
What are the benefits of creating personalized dashboards?
Several advantages make personalized dashboards a tool that users should rely on daily:
Custom Reports
Operators and any other user with access rights can create custom reports to send to various supervisors,
such as the security manager.
Multiple Data
Any type of data can be imported into the dashboards, and you can also create specific sections for each type of data.
Data Centralization
All important data you select will be centralized on a single interface, eliminating the need to search for data across multiple spaces.
Multiple Users
Depending on their access rights, any user can create personalized dashboards at any time of the day.
PSIM and dashboards, the perfect combination for your security?
The utility of creating personalized dashboards to gather data, have an overview, and optimize security systems, equipment, and processes is indispensable, especially when combined with the use of PSIM software.
Real-time data flow can integrate directly into a hypervisor's functionality, allowing you to create sections in your dashboards for a more precise overview.
The real-time data flow can integrate directly into a hypervisor's functionality, allowing you to subsequently create sections in your dashboards to have a more precise overall view.
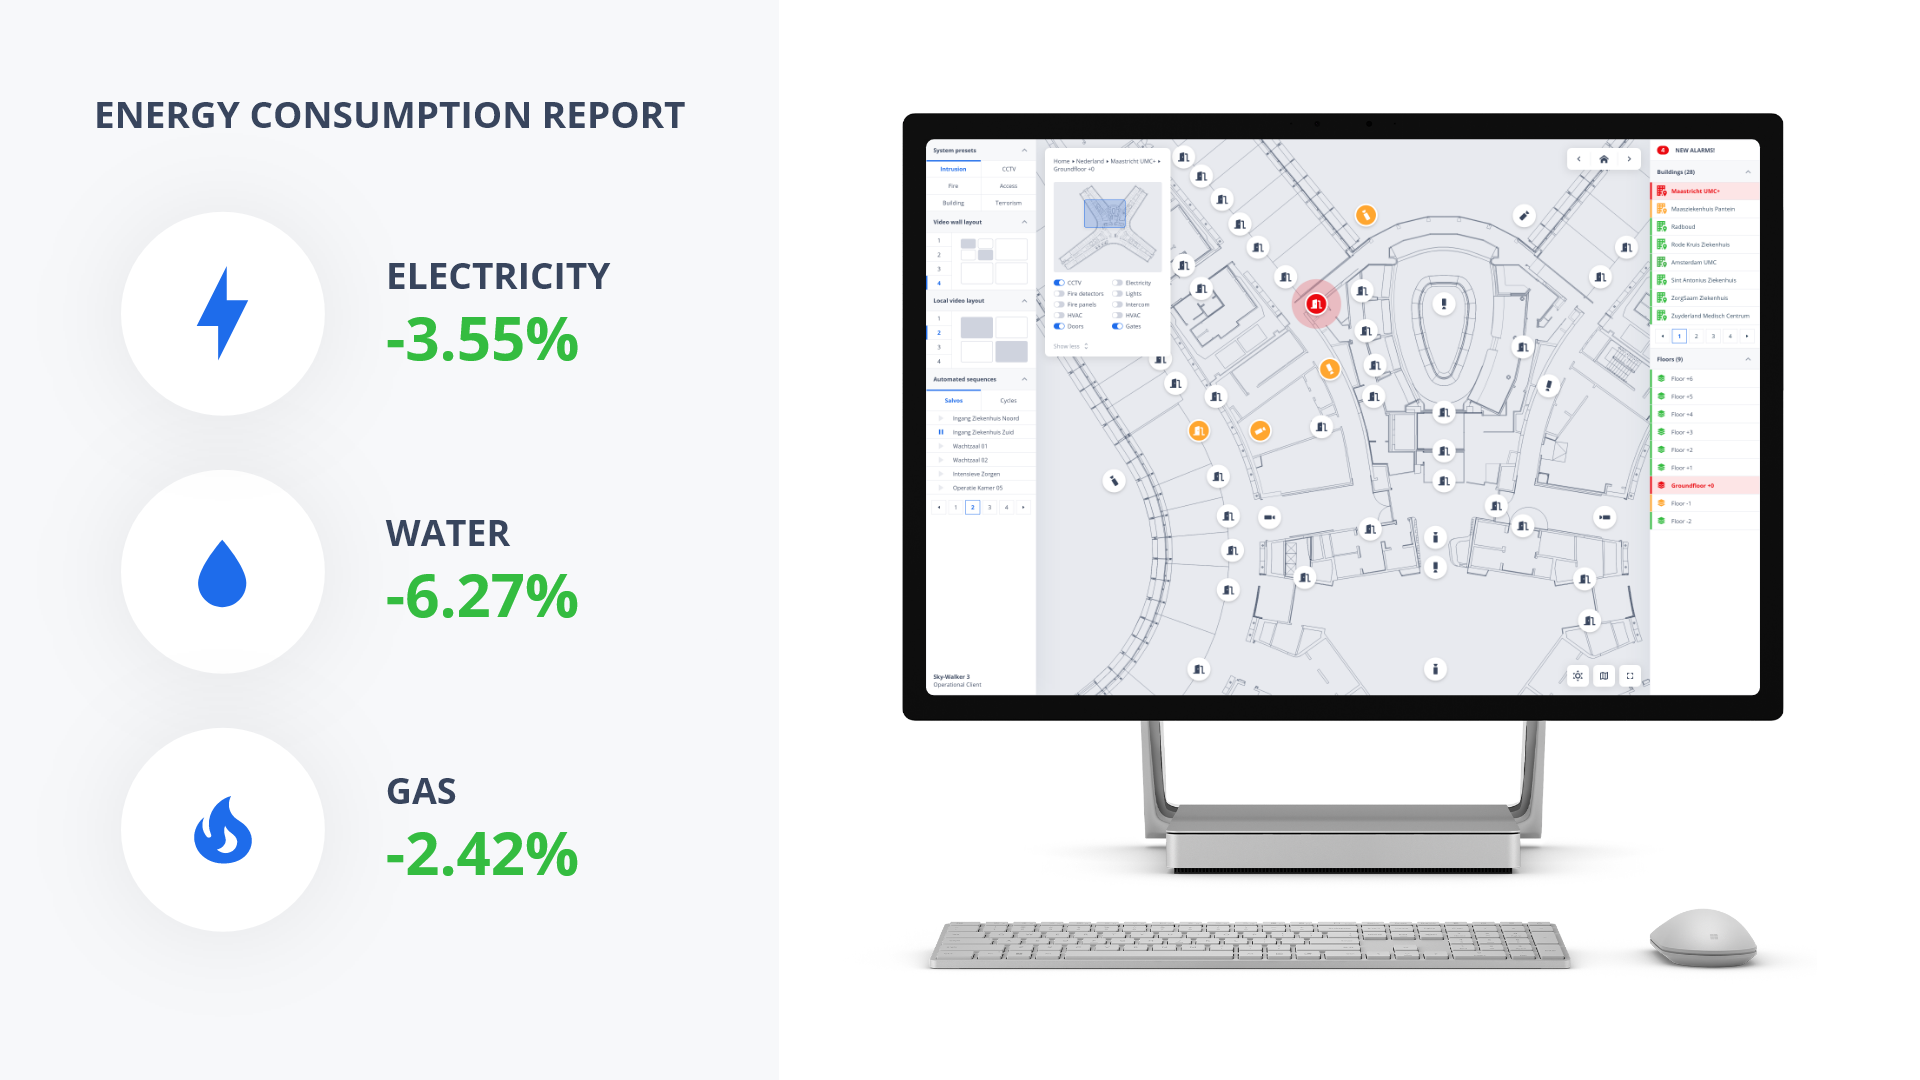
Any type of data can be incorporated into your dashboards, including security, safety, or building comfort data. Combined with the data, you can also visualize real-time statistics such as the number of occupants in a building or the energy consumption of a building.
The goal is to enhance your daily security.
The functionality of dashboards and statistics in PSIM software offers you the opportunity to:
- Schedule maintenance on your systems and equipment
- Optimize comfort to reduce the energy consumption of your buildings
- Establish periodic automated usage on your systems and equipment
- Install potential new technologies